 Not very many. Or why consumer spending has been dragging for years.
One more thing about the new Census Bureau’s Income and Poverty report for 2016, which found to the great excitement in the media that median household income, adjusted for inflation (via CPI), rose 3.2% in 2016 to $59,039 – finally a tad above where it had been 17 years ago.
We already found buried in it that inflation-adjusted earnings from wages, salaries, etc. for full-time employed men have fallen 4.4% since 1973.
So now, we’ll look at another data set buried in the Census Bureau’s report, which is based on respondents at 98,000 addresses across the US. We want to know which households were the lucky ones – and turns out, there weren’t very many.
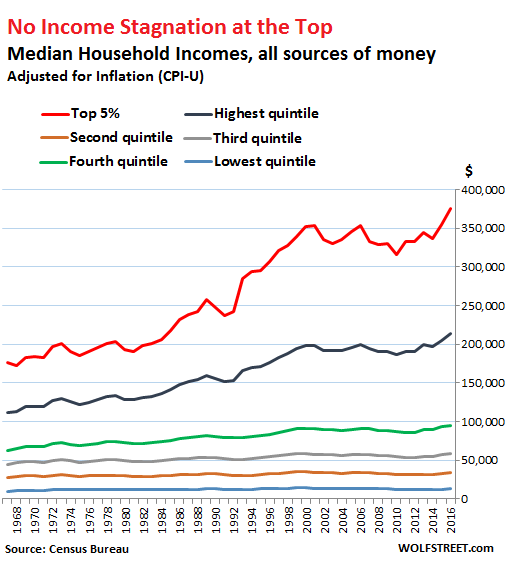
‘Earnings’ in this report are the fruits of labor – so wages, salaries, and the like. ‘Household income’ includes not only ‘earnings’ but also money from other sources during the year. These are the sources of ‘household income’ in the report:
This post was published at Wolf Street on Sep 14, 2017.

 Follow on Twitter
Recent Comments