 This confirms what many Americans feel in their wallets.
In the data today on personal income and outlays for September was a hefty shot of reality that many Americans have been feeling in their wallets on a daily basis: On a personal level, per individual, or ‘per capita,’ the disposable income adjusted for inflation looks lousy. In fact, it declined in September and has been declining since May.
At first glance, as per headlines, the data looked pretty good. For example:
WSJ: ‘U. S. Consumer Spending Rose Robustly in September: Personal income, which includes wages and government assistance, was up 0.4% from August.’ New York Times: ‘U. S. Consumer Spending Grows at Fastest Pace Since 2009, Savings Drop.’ It pointed out that ‘the drop in savings suggests that September’s robust pace of consumer spending is probably unsustainable.’ But it’s not the drop in savings that’s the problem; it’s the drop in disposable income per capita.
First consumer spending, because that’s what grabbed the headlines. Personal Consumption Expenditures rose 2.7% from a year ago, adjusted for inflation, according to the Bureau of Economic Analysis. That’s smack dab in the middle of the range since 2010, whose low point was +1% (October 2012 and April 2013) and whose peak was +4.2% in January 2015.
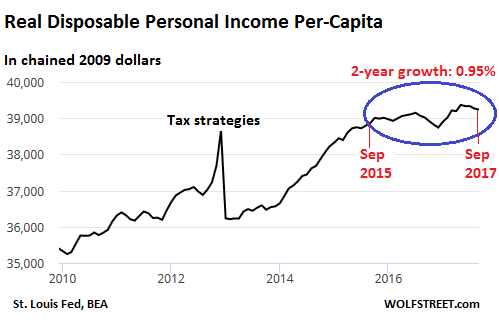
Consumer spending was what the media focused on. But the report’s larger section on ‘real’ disposable income wasn’t pretty: it rose only 1.2% compared to a year ago.
This post was published at Wolf Street on Oct 30, 2017.

 Follow on Twitter
Recent Comments