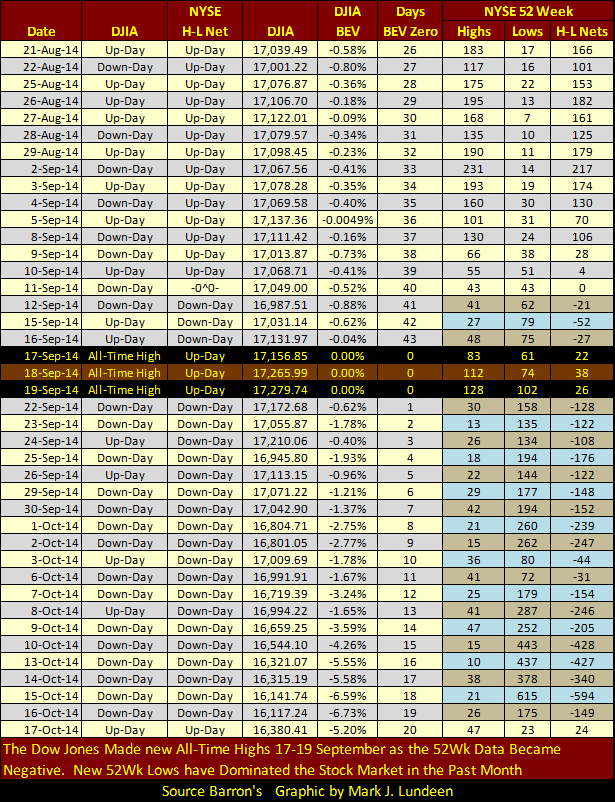
 Two weeks ago (October 3rd) I noted the bearish NYSE 52Wk High & Low data that began just days before the Dow Jones reached it latest all-time high on September 19th. I included the table below (with data updated to October 3rd), along with the following comments:
‘Looking at the action in the 52Wk Highs and Lows in the table below, I’m not predicting the Dow Jones all-time highs of September 17-19 will prove to be a historic high, such as the ones seen in January 2000 and October 2007. However, when the ultimate top of this bull cycledoes come and pass by, it will look like this.’
At the close of this past week, downward pressure on share prices has eased off a bit but over the past month the NYSE’s 52Wk Lows continue to overwhelm its 52Wk Highs. It’s obvious the problem the market is having here; the ‘policy makers’ have grossly over-inflated the stock market valuations which now want to deflate. It’s that simple, except the ‘policy makers’ likethe inflated market valuations and will oppose deflation with as much ‘liquidity’ as they dare to ‘inject.’ Anyway I’m sure that’s their plan and their main concern.
If they are successful we’ll again see NYSE 52Wk Highs outnumber 52Wk Lows and morenew all-time highs on the Dow Jones. If they’re not successful, we’ll continue seeing NYSE 52Wk Lows overwhelm 52Wk Highs in ever greater numbers for the rest of 2014, continuing into 2015 as the Dow Jones resumes the bear market interrupted by the ‘policy makers’ in March 2009. That said, as bad as it may get we’ll still see some days like today (Friday Oct 17th) when 52Wk Highs outnumber Lows, but one good day does not a bull market make. Personally I think the ‘policy makers’ are approaching their Waterloo here, because there are limits to what currency debauchery can achieve in the financial markets.
This post was published at Gold-Eagle on October 19, 2014.

 Follow on Twitter
Recent Comments